Some Investors May Be Worried About SJM Holdings' (HKG:880) Returns On Capital
Ignoring the stock price of a company, what are the underlying trends that tell us a business is past the growth phase? When we see a declining return on capital employed (ROCE) in conjunction with a declining base of capital employed, that's often how a mature business shows signs of aging. This combination can tell you that not only is the company investing less, it's earning less on what it does invest. Having said that, after a brief look, SJM Holdings (HKG:880) we aren't filled with optimism, but let's investigate further.
Return On Capital Employed (ROCE): What Is It?
Just to clarify if you're unsure, ROCE is a metric for evaluating how much pre-tax income (in percentage terms) a company earns on the capital invested in its business. To calculate this metric for SJM Holdings, this is the formula:
Return on Capital Employed = Earnings Before Interest and Tax (EBIT) ÷ (Total Assets - Current Liabilities)
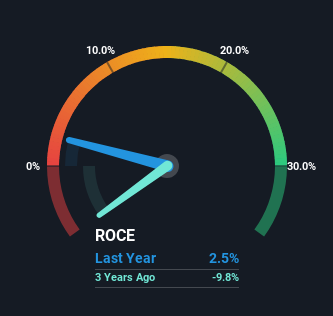
0.025 = HK$1.1b ÷ (HK$48b - HK$5.2b) (Based on the trailing twelve months to June 2024).
Thus, SJM Holdings has an ROCE of 2.5%. In absolute terms, that's a low return and it also under-performs the Hospitality industry average of 7.1%.
View our latest analysis for SJM Holdings
In the above chart we have measured SJM Holdings' prior ROCE against its prior performance, but the future is arguably more important. If you'd like, you can check out the forecasts from the analysts covering SJM Holdings for free.
So How Is SJM Holdings' ROCE Trending?
We are a bit worried about the trend of returns on capital at SJM Holdings. About five years ago, returns on capital were 6.6%, however they're now substantially lower than that as we saw above. On top of that, it's worth noting that the amount of capital employed within the business has remained relatively steady. This combination can be indicative of a mature business that still has areas to deploy capital, but the returns received aren't as high due potentially to new competition or smaller margins. If these trends continue, we wouldn't expect SJM Holdings to turn into a multi-bagger.
On a related note, SJM Holdings has decreased its current liabilities to 11% of total assets. That could partly explain why the ROCE has dropped. What's more, this can reduce some aspects of risk to the business because now the company's suppliers or short-term creditors are funding less of its operations. Some would claim this reduces the business' efficiency at generating ROCE since it is now funding more of the operations with its own money.
The Bottom Line On SJM Holdings' ROCE
All in all, the lower returns from the same amount of capital employed aren't exactly signs of a compounding machine. This could explain why the stock has sunk a total of 70% in the last five years. Unless there is a shift to a more positive trajectory in these metrics, we would look elsewhere.
If you'd like to know about the risks facing SJM Holdings, we've discovered 1 warning sign that you should be aware of.
While SJM Holdings may not currently earn the highest returns, we've compiled a list of companies that currently earn more than 25% return on equity. Check out this free list here.
New: Manage All Your Stock Portfolios in One Place
We've created the ultimate portfolio companion for stock investors, and it's free.
• Connect an unlimited number of Portfolios and see your total in one currency• Be alerted to new Warning Signs or Risks via email or mobile• Track the Fair Value of your stocks
Try a Demo Portfolio for FreeHave feedback on this article? Concerned about the content? Get in touch with us directly. Alternatively, email editorial-team (at) simplywallst.com.This article by Simply Wall St is general in nature. We provide commentary based on historical data and analyst forecasts only using an unbiased methodology and our articles are not intended to be financial advice. It does not constitute a recommendation to buy or sell any stock, and does not take account of your objectives, or your financial situation. We aim to bring you long-term focused analysis driven by fundamental data. Note that our analysis may not factor in the latest price-sensitive company announcements or qualitative material. Simply Wall St has no position in any stocks mentioned.
免责声明:投资有风险,本文并非投资建议,以上内容不应被视为任何金融产品的购买或出售要约、建议或邀请,作者或其他用户的任何相关讨论、评论或帖子也不应被视为此类内容。本文仅供一般参考,不考虑您的个人投资目标、财务状况或需求。TTM对信息的准确性和完整性不承担任何责任或保证,投资者应自行研究并在投资前寻求专业建议。
热议股票
- 1
- 2
- 3
- 4
- 5
- 6
- 7
- 8
- 9
- 10