Market Participants Recognise Bradaverse Education (Int'l) Investments Group Limited's (HKG:1082) Revenues
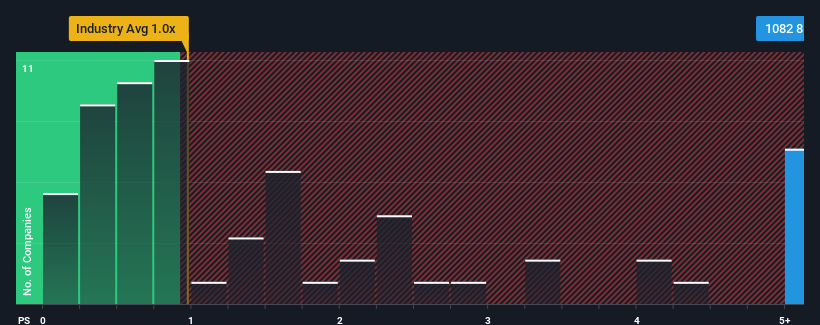
Bradaverse Education (Int'l) Investments Group Limited's (HKG:1082) price-to-sales (or "P/S") ratio of 8.5x may look like a poor investment opportunity when you consider close to half the companies in the Consumer Services industry in Hong Kong have P/S ratios below 1x. Nonetheless, we'd need to dig a little deeper to determine if there is a rational basis for the highly elevated P/S.
See our latest analysis for Bradaverse Education (Int'l) Investments Group
How Has Bradaverse Education (Int'l) Investments Group Performed Recently?
Bradaverse Education (Int'l) Investments Group has been doing a decent job lately as it's been growing revenue at a reasonable pace. It might be that many expect the reasonable revenue performance to beat most other companies over the coming period, which has increased investors’ willingness to pay up for the stock. You'd really hope so, otherwise you're paying a pretty hefty price for no particular reason.
Want the full picture on earnings, revenue and cash flow for the company? Then our free report on Bradaverse Education (Int'l) Investments Group will help you shine a light on its historical performance.Do Revenue Forecasts Match The High P/S Ratio?
Bradaverse Education (Int'l) Investments Group's P/S ratio would be typical for a company that's expected to deliver very strong growth, and importantly, perform much better than the industry.
If we review the last year of revenue growth, the company posted a worthy increase of 5.6%. Pleasingly, revenue has also lifted 187% in aggregate from three years ago, partly thanks to the last 12 months of growth. So we can start by confirming that the company has done a great job of growing revenues over that time.
This is in contrast to the rest of the industry, which is expected to grow by 19% over the next year, materially lower than the company's recent medium-term annualised growth rates.
In light of this, it's understandable that Bradaverse Education (Int'l) Investments Group's P/S sits above the majority of other companies. It seems most investors are expecting this strong growth to continue and are willing to pay more for the stock.
The Bottom Line On Bradaverse Education (Int'l) Investments Group's P/S
We'd say the price-to-sales ratio's power isn't primarily as a valuation instrument but rather to gauge current investor sentiment and future expectations.
We've established that Bradaverse Education (Int'l) Investments Group maintains its high P/S on the strength of its recent three-year growth being higher than the wider industry forecast, as expected. In the eyes of shareholders, the probability of a continued growth trajectory is great enough to prevent the P/S from pulling back. Unless the recent medium-term conditions change, they will continue to provide strong support to the share price.
Many other vital risk factors can be found on the company's balance sheet. Our free balance sheet analysis for Bradaverse Education (Int'l) Investments Group with six simple checks will allow you to discover any risks that could be an issue.
If strong companies turning a profit tickle your fancy, then you'll want to check out this free list of interesting companies that trade on a low P/E (but have proven they can grow earnings).
Valuation is complex, but we're here to simplify it.
Discover if Bradaverse Education (Int'l) Investments Group might be undervalued or overvalued with our detailed analysis, featuring fair value estimates, potential risks, dividends, insider trades, and its financial condition.
Access Free AnalysisHave feedback on this article? Concerned about the content? Get in touch with us directly. Alternatively, email editorial-team (at) simplywallst.com.This article by Simply Wall St is general in nature. We provide commentary based on historical data and analyst forecasts only using an unbiased methodology and our articles are not intended to be financial advice. It does not constitute a recommendation to buy or sell any stock, and does not take account of your objectives, or your financial situation. We aim to bring you long-term focused analysis driven by fundamental data. Note that our analysis may not factor in the latest price-sensitive company announcements or qualitative material. Simply Wall St has no position in any stocks mentioned.
免责声明:投资有风险,本文并非投资建议,以上内容不应被视为任何金融产品的购买或出售要约、建议或邀请,作者或其他用户的任何相关讨论、评论或帖子也不应被视为此类内容。本文仅供一般参考,不考虑您的个人投资目标、财务状况或需求。TTM对信息的准确性和完整性不承担任何责任或保证,投资者应自行研究并在投资前寻求专业建议。
热议股票
- 1
- 2
- 3
- 4
- 5
- 6
- 7
- 8
- 9
- 10