Asian Market Value Picks: 3 Stocks That May Be Trading At A Discount
As global markets grapple with trade policy uncertainties and inflation concerns, Asian indices have shown resilience amid these challenges. In this environment, identifying undervalued stocks can offer potential opportunities for investors seeking value plays in the region.
Top 10 Undervalued Stocks Based On Cash Flows In Asia
| Name | Current Price | Fair Value (Est) | Discount (Est) |
| DIT (KOSDAQ:A110990) | ₩13920.00 | ₩27509.14 | 49.4% |
| Precision Tsugami (China) (SEHK:1651) | HK$21.00 | HK$41.82 | 49.8% |
| Hyosung Heavy Industries (KOSE:A298040) | ₩422500.00 | ₩844375.82 | 50% |
| Nan Ya Printed Circuit Board (TWSE:8046) | NT$132.50 | NT$262.44 | 49.5% |
| Hugel (KOSDAQ:A145020) | ₩322000.00 | ₩641703.18 | 49.8% |
| Sung Kwang BendLtd (KOSDAQ:A014620) | ₩27700.00 | ₩55171.46 | 49.8% |
| BalnibarbiLtd (TSE:3418) | ¥1090.00 | ¥2167.30 | 49.7% |
| OPT Machine Vision Tech (SHSE:688686) | CN¥103.55 | CN¥204.50 | 49.4% |
| Zhejiang Leapmotor Technology (SEHK:9863) | HK$41.50 | HK$82.37 | 49.6% |
| Doosan Fuel Cell (KOSE:A336260) | ₩15990.00 | ₩31590.14 | 49.4% |
Click here to see the full list of 284 stocks from our Undervalued Asian Stocks Based On Cash Flows screener.
Underneath we present a selection of stocks filtered out by our screen.
Shanghai Chicmax Cosmetic (SEHK:2145)
Overview: Shanghai Chicmax Cosmetic Co., Ltd. is a multi-brand cosmetics company involved in the research, development, manufacture, and sale of skincare, maternity, and childcare products in China with a market cap of HK$15.80 billion.
Operations: The company's revenue is primarily derived from the manufacture and sale of cosmetic products, totaling CN¥6.11 billion.
Estimated Discount To Fair Value: 47.8%
Shanghai Chicmax Cosmetic is trading at HK$39.7, significantly below its estimated fair value of HK$76.04, suggesting undervaluation based on discounted cash flow analysis. Analysts forecast revenue growth of 20.7% annually, outpacing the Hong Kong market's average and supported by strong performance from its KANS brand. The company expects 2024 revenue between RMB 6.7 billion to RMB 6.9 billion and profit between RMB 750 million to RMB 810 million, reflecting robust growth over the previous year despite a dividend not well covered by free cash flows.
- Our comprehensive growth report raises the possibility that Shanghai Chicmax Cosmetic is poised for substantial financial growth.
- Delve into the full analysis health report here for a deeper understanding of Shanghai Chicmax Cosmetic.
BYD Electronic (International) (SEHK:285)
Overview: BYD Electronic (International) Company Limited is an investment holding company involved in designing, manufacturing, assembling, and selling mobile handset components and modules both in China and internationally, with a market cap of approximately HK$111.42 billion.
Operations: The company's revenue primarily comes from the manufacture, assembly, and sale of mobile handset components and modules, totaling approximately CN¥152.36 billion.
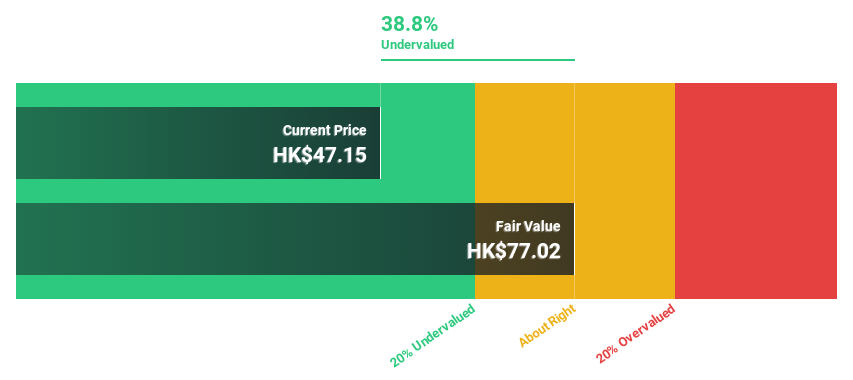
Estimated Discount To Fair Value: 34.7%
BYD Electronic (International) is trading at HK$49.45, significantly below its estimated fair value of HK$75.7, highlighting undervaluation based on discounted cash flow analysis. Earnings are projected to grow substantially at 25.6% annually over the next three years, surpassing the Hong Kong market's average growth rate of 11.7%. However, despite robust earnings growth prospects, its forecasted Return on Equity in three years is relatively low at 17.5%.
- Our earnings growth report unveils the potential for significant increases in BYD Electronic (International)'s future results.
- Click here and access our complete balance sheet health report to understand the dynamics of BYD Electronic (International).

FIT Hon Teng (SEHK:6088)
Overview: FIT Hon Teng Limited manufactures and sells mobile and wireless devices and connectors in Taiwan and internationally, with a market cap of HK$22.04 billion.
Operations: The company's revenue segments include Consumer Products at $690.95 million and Intermediate Products at $3.94 billion.
Estimated Discount To Fair Value: 21.3%
FIT Hon Teng is trading at HK$3.11, below its estimated fair value of HK$3.95, indicating undervaluation based on discounted cash flow analysis. Revenue is expected to grow 16.2% annually, outpacing the Hong Kong market's 7.8%. Earnings are forecasted to increase significantly at 31% per year over the next three years, although Return on Equity remains low at 10.6%. The stock has experienced high volatility recently but offers potential value for investors focused on cash flows.
- Upon reviewing our latest growth report, FIT Hon Teng's projected financial performance appears quite optimistic.
- Take a closer look at FIT Hon Teng's balance sheet health here in our report.
Make It Happen
- Take a closer look at our Undervalued Asian Stocks Based On Cash Flows list of 284 companies by clicking here.
- Invested in any of these stocks? Simplify your portfolio management with Simply Wall St and stay ahead with our alerts for any critical updates on your stocks.
- Enhance your investing ability with the Simply Wall St app and enjoy free access to essential market intelligence spanning every continent.
Looking For Alternative Opportunities?
- Explore high-performing small cap companies that haven't yet garnered significant analyst attention.
- Diversify your portfolio with solid dividend payers offering reliable income streams to weather potential market turbulence.
- Fuel your portfolio with companies showing strong growth potential, backed by optimistic outlooks both from analysts and management.
This article by Simply Wall St is general in nature. We provide commentary based on historical data and analyst forecasts only using an unbiased methodology and our articles are not intended to be financial advice. It does not constitute a recommendation to buy or sell any stock, and does not take account of your objectives, or your financial situation. We aim to bring you long-term focused analysis driven by fundamental data. Note that our analysis may not factor in the latest price-sensitive company announcements or qualitative material. Simply Wall St has no position in any stocks mentioned.
Valuation is complex, but we're here to simplify it.
Discover if BYD Electronic (International) might be undervalued or overvalued with our detailed analysis, featuring fair value estimates, potential risks, dividends, insider trades, and its financial condition.
Access Free AnalysisHave feedback on this article? Concerned about the content? Get in touch with us directly. Alternatively, email editorial-team@simplywallst.com
免责声明:投资有风险,本文并非投资建议,以上内容不应被视为任何金融产品的购买或出售要约、建议或邀请,作者或其他用户的任何相关讨论、评论或帖子也不应被视为此类内容。本文仅供一般参考,不考虑您的个人投资目标、财务状况或需求。TTM对信息的准确性和完整性不承担任何责任或保证,投资者应自行研究并在投资前寻求专业建议。
热议股票
- 1
- 2
- 3
- 4
- 5
- 6
- 7
- 8
- 9
- 10