MS Group Holdings Limited's (HKG:1451) Stock's On An Uptrend: Are Strong Financials Guiding The Market?
Most readers would already be aware that MS Group Holdings' (HKG:1451) stock increased significantly by 57% over the past three months. Since the market usually pay for a company’s long-term fundamentals, we decided to study the company’s key performance indicators to see if they could be influencing the market. Particularly, we will be paying attention to MS Group Holdings' ROE today.
Return on equity or ROE is an important factor to be considered by a shareholder because it tells them how effectively their capital is being reinvested. In simpler terms, it measures the profitability of a company in relation to shareholder's equity.
See our latest analysis for MS Group Holdings
How To Calculate Return On Equity?
Return on equity can be calculated by using the formula:
Return on Equity = Net Profit (from continuing operations) ÷ Shareholders' Equity
So, based on the above formula, the ROE for MS Group Holdings is:
12% = HK$26m ÷ HK$215m (Based on the trailing twelve months to June 2024).
The 'return' is the amount earned after tax over the last twelve months. One way to conceptualize this is that for each HK$1 of shareholders' capital it has, the company made HK$0.12 in profit.
What Is The Relationship Between ROE And Earnings Growth?
Thus far, we have learned that ROE measures how efficiently a company is generating its profits. Based on how much of its profits the company chooses to reinvest or "retain", we are then able to evaluate a company's future ability to generate profits. Generally speaking, other things being equal, firms with a high return on equity and profit retention, have a higher growth rate than firms that don’t share these attributes.
MS Group Holdings' Earnings Growth And 12% ROE
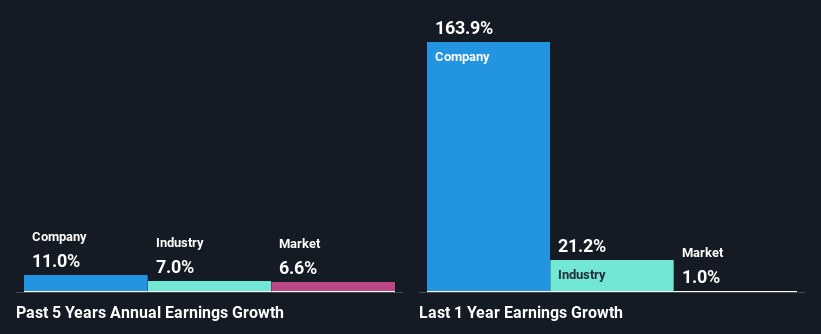
To start with, MS Group Holdings' ROE looks acceptable. Especially when compared to the industry average of 7.2% the company's ROE looks pretty impressive. This probably laid the ground for MS Group Holdings' moderate 11% net income growth seen over the past five years.
As a next step, we compared MS Group Holdings' net income growth with the industry, and pleasingly, we found that the growth seen by the company is higher than the average industry growth of 7.0%.
Earnings growth is an important metric to consider when valuing a stock. It’s important for an investor to know whether the market has priced in the company's expected earnings growth (or decline). This then helps them determine if the stock is placed for a bright or bleak future. If you're wondering about MS Group Holdings''s valuation, check out this gauge of its price-to-earnings ratio, as compared to its industry.
Is MS Group Holdings Efficiently Re-investing Its Profits?
With a three-year median payout ratio of 46% (implying that the company retains 54% of its profits), it seems that MS Group Holdings is reinvesting efficiently in a way that it sees respectable amount growth in its earnings and pays a dividend that's well covered.
While MS Group Holdings has seen growth in its earnings, it only recently started to pay a dividend. It is most likely that the company decided to impress new and existing shareholders with a dividend.
Summary
Overall, we are quite pleased with MS Group Holdings' performance. Particularly, we like that the company is reinvesting heavily into its business, and at a high rate of return. Unsurprisingly, this has led to an impressive earnings growth. If the company continues to grow its earnings the way it has, that could have a positive impact on its share price given how earnings per share influence long-term share prices. Let's not forget, business risk is also one of the factors that affects the price of the stock. So this is also an important area that investors need to pay attention to before making a decision on any business. Our risks dashboard would have the 3 risks we have identified for MS Group Holdings.
New: Manage All Your Stock Portfolios in One Place
We've created the ultimate portfolio companion for stock investors, and it's free.
• Connect an unlimited number of Portfolios and see your total in one currency• Be alerted to new Warning Signs or Risks via email or mobile• Track the Fair Value of your stocks
Try a Demo Portfolio for FreeHave feedback on this article? Concerned about the content? Get in touch with us directly. Alternatively, email editorial-team (at) simplywallst.com.This article by Simply Wall St is general in nature. We provide commentary based on historical data and analyst forecasts only using an unbiased methodology and our articles are not intended to be financial advice. It does not constitute a recommendation to buy or sell any stock, and does not take account of your objectives, or your financial situation. We aim to bring you long-term focused analysis driven by fundamental data. Note that our analysis may not factor in the latest price-sensitive company announcements or qualitative material. Simply Wall St has no position in any stocks mentioned.
免责声明:投资有风险,本文并非投资建议,以上内容不应被视为任何金融产品的购买或出售要约、建议或邀请,作者或其他用户的任何相关讨论、评论或帖子也不应被视为此类内容。本文仅供一般参考,不考虑您的个人投资目标、财务状况或需求。TTM对信息的准确性和完整性不承担任何责任或保证,投资者应自行研究并在投资前寻求专业建议。
热议股票
- 1
- 2
- 3
- 4
- 5
- 6
- 7
- 8
- 9
- 10