The Market Doesn't Like What It Sees From St Barbara Limited's (ASX:SBM) Revenues Yet As Shares Tumble 29%
Unfortunately for some shareholders, the St Barbara Limited (ASX:SBM) share price has dived 29% in the last thirty days, prolonging recent pain. Longer-term, the stock has been solid despite a difficult 30 days, gaining 18% in the last year.
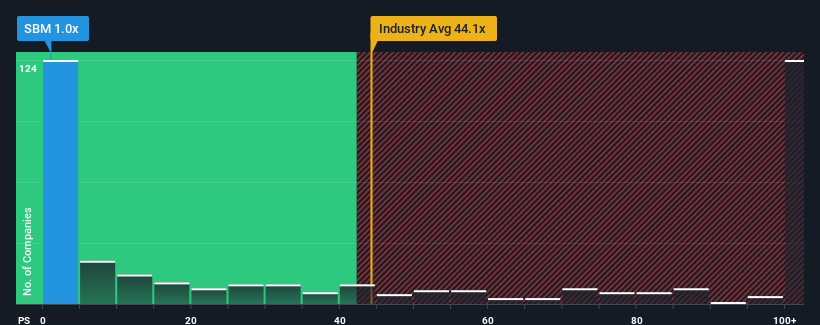
Following the heavy fall in price, St Barbara may look like a strong buying opportunity at present with its price-to-sales (or "P/S") ratio of 1x, considering almost half of all companies in the Metals and Mining industry in Australia have P/S ratios greater than 46.8x and even P/S higher than 255x aren't out of the ordinary. Nonetheless, we'd need to dig a little deeper to determine if there is a rational basis for the highly reduced P/S.
View our latest analysis for St Barbara
How St Barbara Has Been Performing
There hasn't been much to differentiate St Barbara's and the industry's retreating revenue lately. It might be that many expect the company's revenue performance to degrade further, which has repressed the P/S. So while you could say the stock is cheap, investors will be looking for improvement before they see it as good value. In saying that, existing shareholders may feel hopeful about the share price if the company's revenue continues tracking the industry.
Want the full picture on analyst estimates for the company? Then our free report on St Barbara will help you uncover what's on the horizon.Do Revenue Forecasts Match The Low P/S Ratio?
St Barbara's P/S ratio would be typical for a company that's expected to deliver very poor growth or even falling revenue, and importantly, perform much worse than the industry.
In reviewing the last year of financials, we were disheartened to see the company's revenues fell to the tune of 26%. As a result, revenue from three years ago have also fallen 70% overall. Accordingly, shareholders would have felt downbeat about the medium-term rates of revenue growth.
Shifting to the future, estimates from the three analysts covering the company suggest revenue should grow by 22% per year over the next three years. With the industry predicted to deliver 118% growth each year, the company is positioned for a weaker revenue result.
In light of this, it's understandable that St Barbara's P/S sits below the majority of other companies. Apparently many shareholders weren't comfortable holding on while the company is potentially eyeing a less prosperous future.
What Does St Barbara's P/S Mean For Investors?
Shares in St Barbara have plummeted and its P/S has followed suit. Typically, we'd caution against reading too much into price-to-sales ratios when settling on investment decisions, though it can reveal plenty about what other market participants think about the company.
As expected, our analysis of St Barbara's analyst forecasts confirms that the company's underwhelming revenue outlook is a major contributor to its low P/S. Shareholders' pessimism on the revenue prospects for the company seems to be the main contributor to the depressed P/S. The company will need a change of fortune to justify the P/S rising higher in the future.
It's always necessary to consider the ever-present spectre of investment risk. We've identified 2 warning signs with St Barbara (at least 1 which is concerning), and understanding these should be part of your investment process.
If these risks are making you reconsider your opinion on St Barbara, explore our interactive list of high quality stocks to get an idea of what else is out there.
If you're looking to trade St Barbara, open an account with the lowest-cost platform trusted by professionals, Interactive Brokers.
With clients in over 200 countries and territories, and access to 160 markets, IBKR lets you trade stocks, options, futures, forex, bonds and funds from a single integrated account.
Enjoy no hidden fees, no account minimums, and FX conversion rates as low as 0.03%, far better than what most brokers offer.
Sponsored ContentNew: Manage All Your Stock Portfolios in One Place
We've created the ultimate portfolio companion for stock investors, and it's free.
• Connect an unlimited number of Portfolios and see your total in one currency• Be alerted to new Warning Signs or Risks via email or mobile• Track the Fair Value of your stocks
Try a Demo Portfolio for FreeHave feedback on this article? Concerned about the content? Get in touch with us directly. Alternatively, email editorial-team (at) simplywallst.com.This article by Simply Wall St is general in nature. We provide commentary based on historical data and analyst forecasts only using an unbiased methodology and our articles are not intended to be financial advice. It does not constitute a recommendation to buy or sell any stock, and does not take account of your objectives, or your financial situation. We aim to bring you long-term focused analysis driven by fundamental data. Note that our analysis may not factor in the latest price-sensitive company announcements or qualitative material. Simply Wall St has no position in any stocks mentioned.
免责声明:投资有风险,本文并非投资建议,以上内容不应被视为任何金融产品的购买或出售要约、建议或邀请,作者或其他用户的任何相关讨论、评论或帖子也不应被视为此类内容。本文仅供一般参考,不考虑您的个人投资目标、财务状况或需求。TTM对信息的准确性和完整性不承担任何责任或保证,投资者应自行研究并在投资前寻求专业建议。
热议股票
- 1
- 2
- 3
- 4
- 5
- 6
- 7
- 8
- 9
- 10