The Returns On Capital At Golden Power Group Holdings (HKG:3919) Don't Inspire Confidence
If we're looking to avoid a business that is in decline, what are the trends that can warn us ahead of time? When we see a declining return on capital employed (ROCE) in conjunction with a declining base of capital employed, that's often how a mature business shows signs of aging. This reveals that the company isn't compounding shareholder wealth because returns are falling and its net asset base is shrinking. So after we looked into Golden Power Group Holdings (HKG:3919), the trends above didn't look too great.
The end of cancer? These 15 emerging AI stocks are developing tech that will allow early identification of life changing diseases like cancer and Alzheimer's.
What Is Return On Capital Employed (ROCE)?
For those that aren't sure what ROCE is, it measures the amount of pre-tax profits a company can generate from the capital employed in its business. To calculate this metric for Golden Power Group Holdings, this is the formula:
Return on Capital Employed = Earnings Before Interest and Tax (EBIT) ÷ (Total Assets - Current Liabilities)
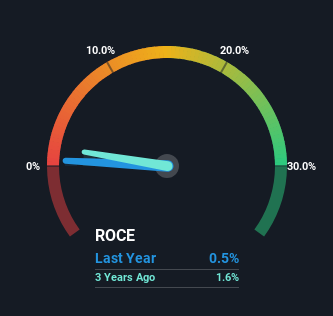
0.0049 = HK$1.5m ÷ (HK$656m - HK$347m) (Based on the trailing twelve months to December 2024).
So, Golden Power Group Holdings has an ROCE of 0.5%. In absolute terms, that's a low return and it also under-performs the Electrical industry average of 6.3%.
See our latest analysis for Golden Power Group Holdings
While the past is not representative of the future, it can be helpful to know how a company has performed historically, which is why we have this chart above. If you'd like to look at how Golden Power Group Holdings has performed in the past in other metrics, you can view this free graph of Golden Power Group Holdings' past earnings, revenue and cash flow.
What The Trend Of ROCE Can Tell Us
We are a bit worried about the trend of returns on capital at Golden Power Group Holdings. To be more specific, the ROCE was 4.4% five years ago, but since then it has dropped noticeably. Meanwhile, capital employed in the business has stayed roughly the flat over the period. Companies that exhibit these attributes tend to not be shrinking, but they can be mature and facing pressure on their margins from competition. If these trends continue, we wouldn't expect Golden Power Group Holdings to turn into a multi-bagger.
On a separate but related note, it's important to know that Golden Power Group Holdings has a current liabilities to total assets ratio of 53%, which we'd consider pretty high. This can bring about some risks because the company is basically operating with a rather large reliance on its suppliers or other sorts of short-term creditors. While it's not necessarily a bad thing, it can be beneficial if this ratio is lower.
What We Can Learn From Golden Power Group Holdings' ROCE
In summary, it's unfortunate that Golden Power Group Holdings is generating lower returns from the same amount of capital. Unsurprisingly then, the stock has dived 83% over the last five years, so investors are recognizing these changes and don't like the company's prospects. That being the case, unless the underlying trends revert to a more positive trajectory, we'd consider looking elsewhere.
Since virtually every company faces some risks, it's worth knowing what they are, and we've spotted 4 warning signs for Golden Power Group Holdings (of which 3 are concerning!) that you should know about.
While Golden Power Group Holdings may not currently earn the highest returns, we've compiled a list of companies that currently earn more than 25% return on equity. Check out this free list here.
New: Manage All Your Stock Portfolios in One Place
We've created the ultimate portfolio companion for stock investors, and it's free.
• Connect an unlimited number of Portfolios and see your total in one currency• Be alerted to new Warning Signs or Risks via email or mobile• Track the Fair Value of your stocks
Try a Demo Portfolio for FreeHave feedback on this article? Concerned about the content? Get in touch with us directly. Alternatively, email editorial-team (at) simplywallst.com.This article by Simply Wall St is general in nature. We provide commentary based on historical data and analyst forecasts only using an unbiased methodology and our articles are not intended to be financial advice. It does not constitute a recommendation to buy or sell any stock, and does not take account of your objectives, or your financial situation. We aim to bring you long-term focused analysis driven by fundamental data. Note that our analysis may not factor in the latest price-sensitive company announcements or qualitative material. Simply Wall St has no position in any stocks mentioned.
免责声明:投资有风险,本文并非投资建议,以上内容不应被视为任何金融产品的购买或出售要约、建议或邀请,作者或其他用户的任何相关讨论、评论或帖子也不应被视为此类内容。本文仅供一般参考,不考虑您的个人投资目标、财务状况或需求。TTM对信息的准确性和完整性不承担任何责任或保证,投资者应自行研究并在投资前寻求专业建议。
热议股票
- 1
- 2
- 3
- 4
- 5
- 6
- 7
- 8
- 9
- 10