Benchmark Electronics, Inc.'s (NYSE:BHE) Stock Has Shown Weakness Lately But Financial Prospects Look Decent: Is The Market Wrong?
Benchmark Electronics (NYSE:BHE) has had a rough three months with its share price down 14%. However, the company's fundamentals look pretty decent, and long-term financials are usually aligned with future market price movements. Particularly, we will be paying attention to Benchmark Electronics' ROE today.
Return on Equity or ROE is a test of how effectively a company is growing its value and managing investors’ money. In short, ROE shows the profit each dollar generates with respect to its shareholder investments.
How Is ROE Calculated?
ROE can be calculated by using the formula:
Return on Equity = Net Profit (from continuing operations) ÷ Shareholders' Equity
So, based on the above formula, the ROE for Benchmark Electronics is:
5.7% = US$63m ÷ US$1.1b (Based on the trailing twelve months to December 2024).
The 'return' is the profit over the last twelve months. That means that for every $1 worth of shareholders' equity, the company generated $0.06 in profit.
See our latest analysis for Benchmark Electronics
What Has ROE Got To Do With Earnings Growth?
Thus far, we have learned that ROE measures how efficiently a company is generating its profits. Based on how much of its profits the company chooses to reinvest or "retain", we are then able to evaluate a company's future ability to generate profits. Assuming everything else remains unchanged, the higher the ROE and profit retention, the higher the growth rate of a company compared to companies that don't necessarily bear these characteristics.
Benchmark Electronics' Earnings Growth And 5.7% ROE
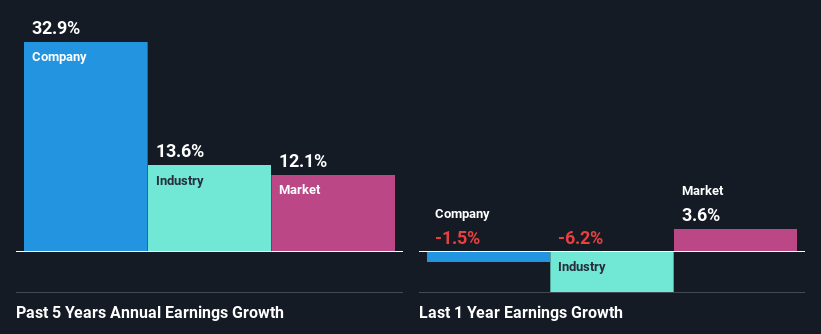
When you first look at it, Benchmark Electronics' ROE doesn't look that attractive. Next, when compared to the average industry ROE of 10%, the company's ROE leaves us feeling even less enthusiastic. In spite of this, Benchmark Electronics was able to grow its net income considerably, at a rate of 33% in the last five years. We reckon that there could be other factors at play here. For example, it is possible that the company's management has made some good strategic decisions, or that the company has a low payout ratio.
We then compared Benchmark Electronics' net income growth with the industry and we're pleased to see that the company's growth figure is higher when compared with the industry which has a growth rate of 14% in the same 5-year period.
Earnings growth is a huge factor in stock valuation. It’s important for an investor to know whether the market has priced in the company's expected earnings growth (or decline). Doing so will help them establish if the stock's future looks promising or ominous. One good indicator of expected earnings growth is the P/E ratio which determines the price the market is willing to pay for a stock based on its earnings prospects. So, you may want to check if Benchmark Electronics is trading on a high P/E or a low P/E, relative to its industry.
Is Benchmark Electronics Using Its Retained Earnings Effectively?
Benchmark Electronics' three-year median payout ratio is a pretty moderate 36%, meaning the company retains 64% of its income. By the looks of it, the dividend is well covered and Benchmark Electronics is reinvesting its profits efficiently as evidenced by its exceptional growth which we discussed above.
Moreover, Benchmark Electronics is determined to keep sharing its profits with shareholders which we infer from its long history of seven years of paying a dividend.
Summary
Overall, we feel that Benchmark Electronics certainly does have some positive factors to consider. Despite its low rate of return, the fact that the company reinvests a very high portion of its profits into its business, no doubt contributed to its high earnings growth. Having said that, the company's earnings growth is expected to slow down, as forecasted in the current analyst estimates. Are these analysts expectations based on the broad expectations for the industry, or on the company's fundamentals? Click here to be taken to our analyst's forecasts page for the company.
Valuation is complex, but we're here to simplify it.
Discover if Benchmark Electronics might be undervalued or overvalued with our detailed analysis, featuring fair value estimates, potential risks, dividends, insider trades, and its financial condition.
Access Free AnalysisHave feedback on this article? Concerned about the content? Get in touch with us directly. Alternatively, email editorial-team (at) simplywallst.com.This article by Simply Wall St is general in nature. We provide commentary based on historical data and analyst forecasts only using an unbiased methodology and our articles are not intended to be financial advice. It does not constitute a recommendation to buy or sell any stock, and does not take account of your objectives, or your financial situation. We aim to bring you long-term focused analysis driven by fundamental data. Note that our analysis may not factor in the latest price-sensitive company announcements or qualitative material. Simply Wall St has no position in any stocks mentioned.
免责声明:投资有风险,本文并非投资建议,以上内容不应被视为任何金融产品的购买或出售要约、建议或邀请,作者或其他用户的任何相关讨论、评论或帖子也不应被视为此类内容。本文仅供一般参考,不考虑您的个人投资目标、财务状况或需求。TTM对信息的准确性和完整性不承担任何责任或保证,投资者应自行研究并在投资前寻求专业建议。
热议股票
- 1
- 2
- 3
- 4
- 5
- 6
- 7
- 8
- 9
- 10