Investors Shouldn't Be Too Comfortable With Shenglong Splendecor International's (HKG:8481) Earnings
Shenglong Splendecor International Limited's (HKG:8481) robust earnings report didn't manage to move the market for its stock. Our analysis suggests that this might be because shareholders have noticed some concerning underlying factors.
We've found 21 US stocks that are forecast to pay a dividend yield of over 6% next year. See the full list for free.
Zooming In On Shenglong Splendecor International's Earnings
One key financial ratio used to measure how well a company converts its profit to free cash flow (FCF) is the accrual ratio. To get the accrual ratio we first subtract FCF from profit for a period, and then divide that number by the average operating assets for the period. You could think of the accrual ratio from cashflow as the 'non-FCF profit ratio'.
Therefore, it's actually considered a good thing when a company has a negative accrual ratio, but a bad thing if its accrual ratio is positive. While having an accrual ratio above zero is of little concern, we do think it's worth noting when a company has a relatively high accrual ratio. Notably, there is some academic evidence that suggests that a high accrual ratio is a bad sign for near-term profits, generally speaking.
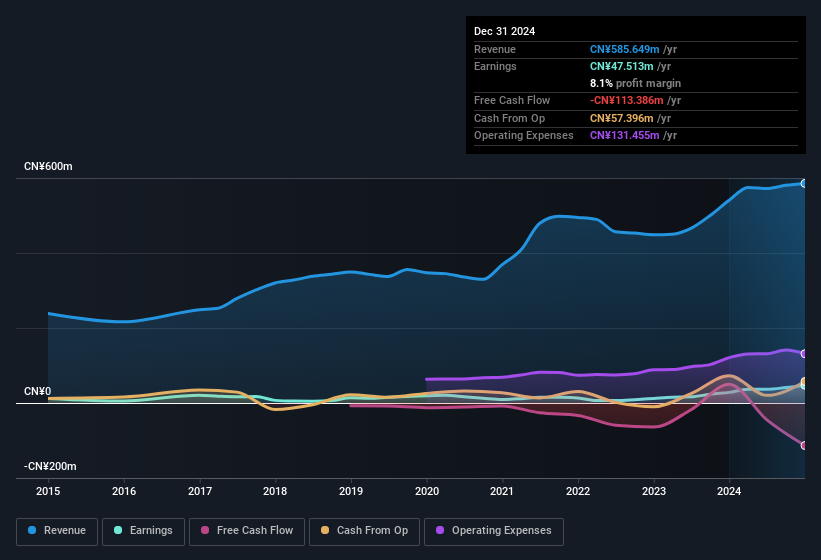
For the year to December 2024, Shenglong Splendecor International had an accrual ratio of 0.31. Unfortunately, that means its free cash flow was a lot less than its statutory profit, which makes us doubt the utility of profit as a guide. Over the last year it actually had negative free cash flow of CN¥113m, in contrast to the aforementioned profit of CN¥47.5m. It's worth noting that Shenglong Splendecor International generated positive FCF of CN¥50m a year ago, so at least they've done it in the past. The good news for shareholders is that Shenglong Splendecor International's accrual ratio was much better last year, so this year's poor reading might simply be a case of a short term mismatch between profit and FCF. Shareholders should look for improved cashflow relative to profit in the current year, if that is indeed the case.
Note: we always recommend investors check balance sheet strength. Click here to be taken to our balance sheet analysis of Shenglong Splendecor International .
Our Take On Shenglong Splendecor International's Profit Performance
Shenglong Splendecor International didn't convert much of its profit to free cash flow in the last year, which some investors may consider rather suboptimal. Because of this, we think that it may be that Shenglong Splendecor International's statutory profits are better than its underlying earnings power. But the good news is that its EPS growth over the last three years has been very impressive. At the end of the day, it's essential to consider more than just the factors above, if you want to understand the company properly. In light of this, if you'd like to do more analysis on the company, it's vital to be informed of the risks involved. To help with this, we've discovered 3 warning signs (2 are significant!) that you ought to be aware of before buying any shares in Shenglong Splendecor International.
Today we've zoomed in on a single data point to better understand the nature of Shenglong Splendecor International's profit. But there are plenty of other ways to inform your opinion of a company. Some people consider a high return on equity to be a good sign of a quality business. While it might take a little research on your behalf, you may find this free collection of companies boasting high return on equity, or this list of stocks with significant insider holdings to be useful.
If you're looking to trade Shenglong Splendecor International, open an account with the lowest-cost platform trusted by professionals, Interactive Brokers.
With clients in over 200 countries and territories, and access to 160 markets, IBKR lets you trade stocks, options, futures, forex, bonds and funds from a single integrated account.
Enjoy no hidden fees, no account minimums, and FX conversion rates as low as 0.03%, far better than what most brokers offer.
Sponsored ContentNew: Manage All Your Stock Portfolios in One Place
We've created the ultimate portfolio companion for stock investors, and it's free.
• Connect an unlimited number of Portfolios and see your total in one currency• Be alerted to new Warning Signs or Risks via email or mobile• Track the Fair Value of your stocks
Try a Demo Portfolio for FreeHave feedback on this article? Concerned about the content? Get in touch with us directly. Alternatively, email editorial-team (at) simplywallst.com.This article by Simply Wall St is general in nature. We provide commentary based on historical data and analyst forecasts only using an unbiased methodology and our articles are not intended to be financial advice. It does not constitute a recommendation to buy or sell any stock, and does not take account of your objectives, or your financial situation. We aim to bring you long-term focused analysis driven by fundamental data. Note that our analysis may not factor in the latest price-sensitive company announcements or qualitative material. Simply Wall St has no position in any stocks mentioned.
免责声明:投资有风险,本文并非投资建议,以上内容不应被视为任何金融产品的购买或出售要约、建议或邀请,作者或其他用户的任何相关讨论、评论或帖子也不应被视为此类内容。本文仅供一般参考,不考虑您的个人投资目标、财务状况或需求。TTM对信息的准确性和完整性不承担任何责任或保证,投资者应自行研究并在投资前寻求专业建议。
热议股票
- 1
- 2
- 3
- 4
- 5
- 6
- 7
- 8
- 9
- 10