Should You Buy Stocks on the Rebound After the Market Meltdown? Here's What History Shows.
-
The initial rebound following a major S&P 500 sell-off typically hasn't led to a quick and sustained recovery.
-
Sometimes, the S&P 500 goes on to hit a lower low after bouncing back at first.
-
The S&P 500 has always delivered solid long-term gains in the past.
Many investors might be dizzy from the stock market's frantic swings. The S&P 500 (^GSPC 1.81%) plunged after President Donald Trump's "Liberation Day" announcement of steep "reciprocal tariffs" on nearly every country on the planet. The president's subsequent 90-day pause of most of those tariffs led to the biggest one-day S&P 500 gain in years.
Should you buy stocks on the rebound after the latest market meltdown? Here's what history shows.

Image source: Getty Images.
When buying on the initial rebound paid off quickly
The S&P 500 in its current form (with 500 companies in the index) has been around since 1957. By my count, it has fallen by roughly the same percentage as the latest decline -- or more -- 13 times since then, excluding the most recent drop.
How often did the S&P 500 rebound continue in a mostly straight upward line. Only two times.
The most recent example occurred in 2020. Stocks plunged in February of that year with the COVID-19 pandemic causing lockdowns across the world. However, the S&P 500 began to bounce back in late March. It went on a strong run and had recovered all of the initial losses by the end of the year.

^SPX data by YCharts
In October 2018, the S&P 500 also fell sharply. Near the end of the year, though, it rebounded and maintained strong momentum for months.

^SPX data by YCharts
When the initial rebound was a head fake
Unfortunately, most initial rebounds following a steep decline of the S&P 500 have been temporary. Sometimes, the index bounces around near its lows for months after the first rebound. The big sell-off in 1957 is a good example.

^SPX data by YCharts
In the first year of the S&P 500 with 500 member companies, the index plunged for several months and then attempted to mount a comeback. The S&P 500 was range-bound into early 1958, though, before it began a more sustained rebound.
Other cases were even worse for investors. In 2000, the dot-com bubble that began in the 1990s burst. The S&P 500 sank like a brick. It tried to bounce back multiple times unsuccessfully. Finally, the index turned things around in the first half of 2003. However, the S&P 500 didn't fully recover until May 2007 -- over seven years after the initial sell-off.

^SPX data by YCharts
Just three years ago, investors were treated to another market feint. The S&P 500 slipped into a bear market in June 2022. At first, it appeared as if the decline would be relatively short-lived. By August, the index had recovered nearly half of its loss. However, the S&P 500 quickly began to fall again, eventually plummeting lower than it had been previously. It didn't fully claw its way back until late 2023.
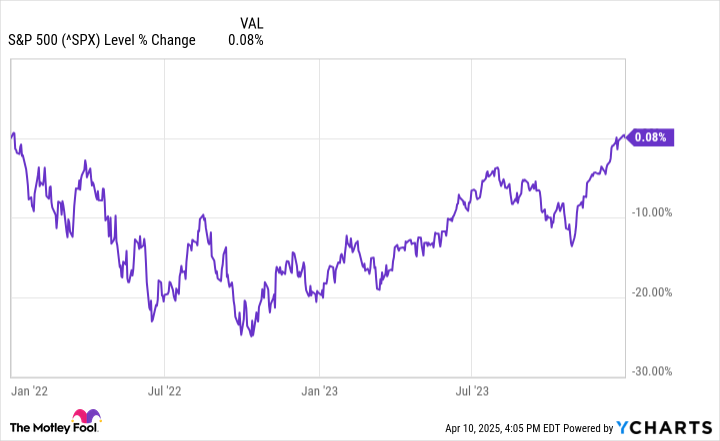
^SPX data by YCharts
History lessons
What lessons can investors glean from the S&P 500's history after major sell-offs? Don't assume that an initial rebound will be a strong one. The index continues to flounder after its first bounce more often than not.
However, I think there's a more important lesson from the S&P 500's past performance: Buying and holding the index over the long term has always paid off.

^SPX data by YCharts
The smartest move, historically speaking, has been to simply invest in the S&P 500 via a mutual fund or exchange-traded fund (ETF) and hang on. Investors who used a dollar-cost averaging strategy have especially been able to reap excellent long-term returns.
Let's return to our original question: Should you buy stocks on the rebound after the latest market meltdown? If you have an investing horizon of five years or more, I think history shows the answer is a resounding "yes."
免责声明:投资有风险,本文并非投资建议,以上内容不应被视为任何金融产品的购买或出售要约、建议或邀请,作者或其他用户的任何相关讨论、评论或帖子也不应被视为此类内容。本文仅供一般参考,不考虑您的个人投资目标、财务状况或需求。TTM对信息的准确性和完整性不承担任何责任或保证,投资者应自行研究并在投资前寻求专业建议。
热议股票
- 1
- 2
- 3
- 4
- 5
- 6
- 7
- 8
- 9
- 10