Subdued Growth No Barrier To ThredUp Inc. (NASDAQ:TDUP) With Shares Advancing 43%
ThredUp Inc. (NASDAQ:TDUP) shares have continued their recent momentum with a 43% gain in the last month alone. The last 30 days bring the annual gain to a very sharp 92%.
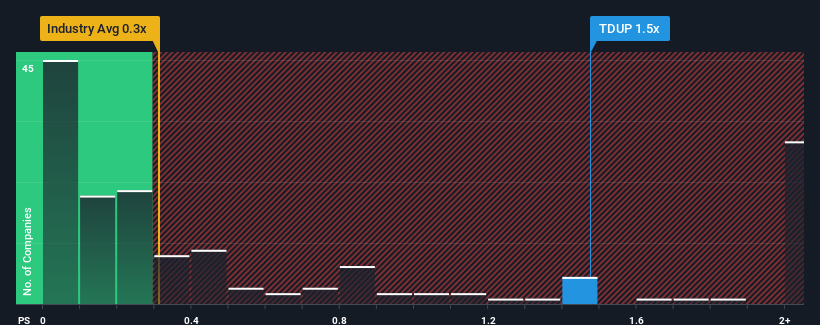
Since its price has surged higher, you could be forgiven for thinking ThredUp is a stock not worth researching with a price-to-sales ratios (or "P/S") of 1.5x, considering almost half the companies in the United States' Specialty Retail industry have P/S ratios below 0.3x. However, the P/S might be high for a reason and it requires further investigation to determine if it's justified.
We've found 21 US stocks that are forecast to pay a dividend yield of over 6% next year. See the full list for free.
Check out our latest analysis for ThredUp
How Has ThredUp Performed Recently?
With revenue growth that's inferior to most other companies of late, ThredUp has been relatively sluggish. One possibility is that the P/S ratio is high because investors think this lacklustre revenue performance will improve markedly. However, if this isn't the case, investors might get caught out paying too much for the stock.
Want the full picture on analyst estimates for the company? Then our free report on ThredUp will help you uncover what's on the horizon.How Is ThredUp's Revenue Growth Trending?
There's an inherent assumption that a company should outperform the industry for P/S ratios like ThredUp's to be considered reasonable.
Retrospectively, the last year delivered virtually the same number to the company's top line as the year before. Likewise, not much has changed from three years ago as revenue have been stuck during that whole time. Therefore, it's fair to say that revenue growth has definitely eluded the company recently.
Shifting to the future, estimates from the five analysts covering the company suggest revenue should grow by 5.9% per annum over the next three years. Meanwhile, the rest of the industry is forecast to expand by 5.8% per annum, which is not materially different.
With this in consideration, we find it intriguing that ThredUp's P/S is higher than its industry peers. It seems most investors are ignoring the fairly average growth expectations and are willing to pay up for exposure to the stock. These shareholders may be setting themselves up for disappointment if the P/S falls to levels more in line with the growth outlook.
The Key Takeaway
The large bounce in ThredUp's shares has lifted the company's P/S handsomely. Using the price-to-sales ratio alone to determine if you should sell your stock isn't sensible, however it can be a practical guide to the company's future prospects.
Analysts are forecasting ThredUp's revenues to only grow on par with the rest of the industry, which has lead to the high P/S ratio being unexpected. Right now we are uncomfortable with the relatively high share price as the predicted future revenues aren't likely to support such positive sentiment for long. This places shareholders' investments at risk and potential investors in danger of paying an unnecessary premium.
Plus, you should also learn about these 2 warning signs we've spotted with ThredUp (including 1 which is significant).
If you're unsure about the strength of ThredUp's business, why not explore our interactive list of stocks with solid business fundamentals for some other companies you may have missed.
If you're looking to trade ThredUp, open an account with the lowest-cost platform trusted by professionals, Interactive Brokers.
With clients in over 200 countries and territories, and access to 160 markets, IBKR lets you trade stocks, options, futures, forex, bonds and funds from a single integrated account.
Enjoy no hidden fees, no account minimums, and FX conversion rates as low as 0.03%, far better than what most brokers offer.
Sponsored ContentValuation is complex, but we're here to simplify it.
Discover if ThredUp might be undervalued or overvalued with our detailed analysis, featuring fair value estimates, potential risks, dividends, insider trades, and its financial condition.
Access Free AnalysisHave feedback on this article? Concerned about the content? Get in touch with us directly. Alternatively, email editorial-team (at) simplywallst.com.This article by Simply Wall St is general in nature. We provide commentary based on historical data and analyst forecasts only using an unbiased methodology and our articles are not intended to be financial advice. It does not constitute a recommendation to buy or sell any stock, and does not take account of your objectives, or your financial situation. We aim to bring you long-term focused analysis driven by fundamental data. Note that our analysis may not factor in the latest price-sensitive company announcements or qualitative material. Simply Wall St has no position in any stocks mentioned.
免责声明:投资有风险,本文并非投资建议,以上内容不应被视为任何金融产品的购买或出售要约、建议或邀请,作者或其他用户的任何相关讨论、评论或帖子也不应被视为此类内容。本文仅供一般参考,不考虑您的个人投资目标、财务状况或需求。TTM对信息的准确性和完整性不承担任何责任或保证,投资者应自行研究并在投资前寻求专业建议。
热议股票
- 1
- 2
- 3
- 4
- 5
- 6
- 7
- 8
- 9
- 10